Earnings per share (EPS) is one of the most widely referenced metrics in investing. It measures how much profit a company generates for each share of common stock outstanding — a simple but powerful lens for evaluating financial performance. Whether you’re analyzing a stock for the first time or comparing companies within an industry, understanding EPS and how to interpret it correctly gives you a meaningful edge as an investor.
EPS appears in quarterly earnings reports, financial news headlines, and analyst projections. But raw numbers rarely tell the full story. Knowing how EPS is calculated, what the different types mean, and where its limitations lie is essential before using it to guide investment decisions.
What Is Earnings Per Share?
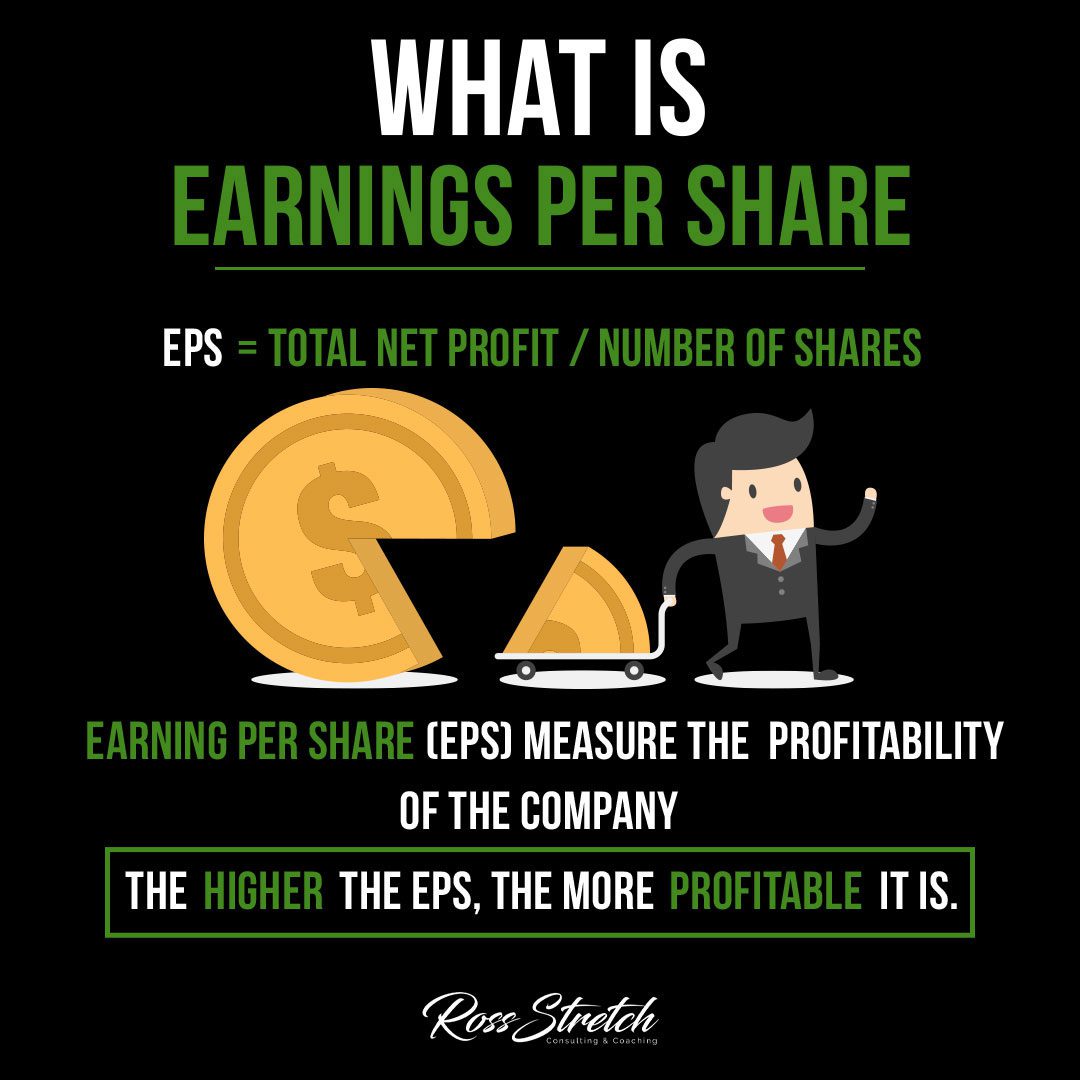
Earnings per share represents the portion of a company’s net profit allocated to each outstanding share of common stock. It’s a per-unit measure of profitability that makes it easier to compare companies of different sizes. A company with $10 million in profit and 10 million shares has the same EPS as a company with $1 billion in profit and 1 billion shares — both report EPS of $1.00.
Public companies are required to report EPS in their financial statements on a quarterly and annual basis. Because EPS is standardized and publicly available, it has become a cornerstone metric for retail and institutional investors alike. However, like any single metric, it works best when combined with other indicators rather than used in isolation.
How EPS Is Calculated
The basic formula is straightforward: subtract preferred dividends from net income, then divide by the weighted average number of common shares outstanding during the reporting period.
EPS = (Net Income − Preferred Dividends) ÷ Weighted Average Common Shares Outstanding
The weighted average accounts for shares issued or repurchased during the year, so a company that buys back stock midway through the year doesn’t simply count shares at year-end. For example, if a company earned $50 million in net income, paid $5 million in preferred dividends, and had 15 million weighted average shares outstanding, its EPS would be ($50M − $5M) ÷ 15M = $3.00.
- Net income is taken from the income statement after taxes and interest
- Preferred dividends are subtracted because EPS measures earnings available to common shareholders
- Weighted average shares account for the timing of share issuances and buybacks throughout the year
Basic EPS vs. Diluted EPS
Companies typically report two versions of EPS: basic and diluted. Basic EPS uses only the shares currently outstanding. Diluted EPS goes further, incorporating all potentially dilutive securities — stock options, convertible bonds, warrants, and other instruments that could convert into common shares. Diluted EPS is almost always lower than basic EPS because adding potential shares to the denominator reduces the per-share figure.
Investors generally pay closer attention to diluted EPS because it presents a more conservative and realistic picture of per-share value. If a company has millions of employee stock options outstanding, those shares could eventually dilute the value of existing shares. Diluted EPS captures that risk upfront.
Some analysts also look at adjusted or non-GAAP EPS, which strips out one-time charges, restructuring costs, or other non-recurring items. This can be useful for understanding core operating performance, but it’s worth scrutinizing what a company excludes — aggressive adjustments can paint an artificially rosy picture of earnings quality.
Using EPS in Investment Analysis
EPS is most useful when examined in context. A single figure means little without knowing the industry average, the company’s historical trend, and analyst expectations. Year-over-year EPS growth signals improving profitability. Consistent growth over multiple years indicates strong fundamentals; erratic swings may signal instability or accounting irregularities worth investigating.
EPS is also the denominator in the price-to-earnings (P/E) ratio, one of the most commonly used valuation tools in equity analysis. A stock trading at $60 with an EPS of $3.00 carries a P/E of 20, meaning investors are paying $20 for every $1 of earnings. Comparing P/E ratios across peers helps determine whether a stock is relatively cheap or expensive. A high P/E can reflect growth expectations — investors may pay a premium for a company expected to grow earnings rapidly.
- Compare EPS growth rate against industry peers and the broader market index
- Use the P/E ratio alongside EPS to assess valuation in context
- Track EPS relative to analyst estimates — beating or missing expectations often moves stock price significantly
- Review multiple quarters and years to identify trends rather than relying on a single snapshot
Limitations of EPS as a Metric
EPS has real blind spots. Because it is based on accounting net income, it can be influenced through legal but aggressive accounting choices — recognizing revenue early, deferring expenses, or capitalizing costs that others expense immediately. Companies can also mechanically inflate EPS by buying back shares, which reduces the share count in the denominator even if the underlying business isn’t growing earnings at all.
EPS also tells you nothing about cash flow. A company can report strong earnings while generating weak free cash flow, which is the actual cash available to grow the business, pay dividends, or reduce debt. For a more complete picture of financial health, pair EPS analysis with cash flow from operations, return on equity, and debt-to-equity ratios.
Finally, EPS comparisons across industries can be misleading. Capital-intensive businesses like utilities or manufacturers will naturally carry different EPS profiles than asset-light software companies. Industry context always matters when interpreting whether a given EPS number is strong or weak for its sector.
Conclusion
Earnings per share is a foundational tool in any investor’s toolkit. It provides a standardized, comparable measure of profitability that cuts through the noise of absolute revenue and profit figures. Used alongside free cash flow analysis, valuation ratios, and industry context, EPS becomes a powerful signal for identifying well-run, profitable businesses worth owning for the long term. Learn to read it critically — not just as a headline number, but as one piece of a larger financial story.
Resources


 Ross Stretch